My Data Science & AI Projects

Explore a curated selection of my work in data analytics, machine learning, deep learning, and more. Click on any project to learn details, see code, or try live demos.

Tip: Use the quick navigation bar below to instantly jump to any project category!
EDA Data Analytics Data Science Machine Learning SQL Tableau

Exploratory Data Analysis Projects

Data exploration, visualization projects python.

Project 4

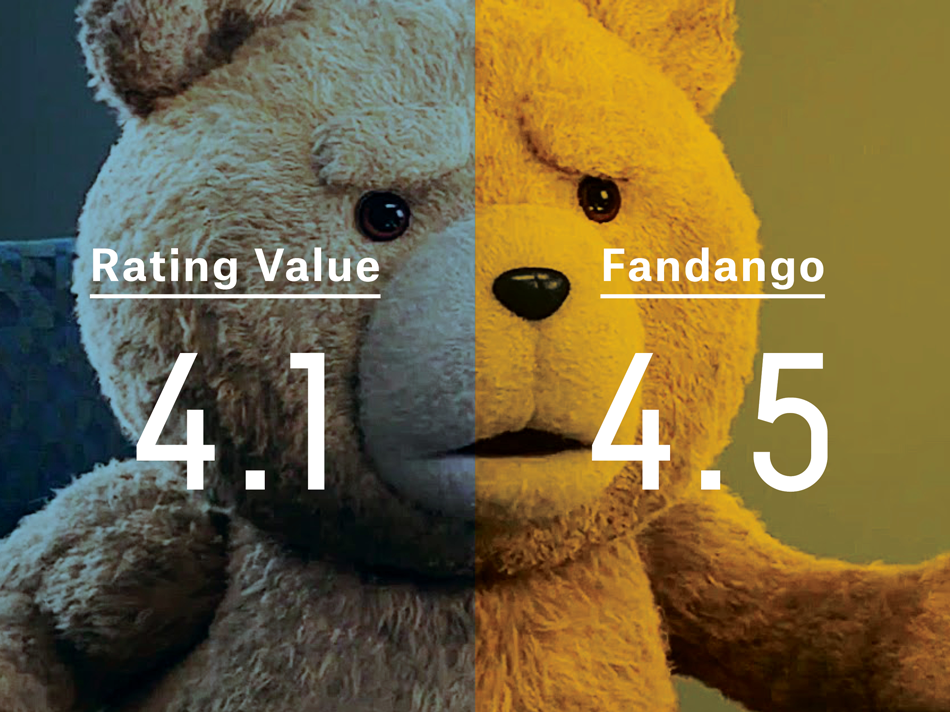
Fandango Ratings Controversy: Case Study

Analysis of Fandango's ratings and the implications on movie reviews. This project explores the discrepancies in ratings and their impact on audience perception.

Python Pandas Matplotlib Seaborn Data Visualization Exploratory Data Analysis
Project 5

Netflix Catalogue Analysis

This project provides an in-depth exploratory data analysis (EDA) of the Netflix Titles dataset. The analysis uncovers trends, patterns, and insights about the content available on Netflix, including movies and TV shows from around the world.

Python Pandas Matplotlib Seaborn Data Visualization Exploratory Data Analysis

Data Analytics Dashboards

Data analytics dashboards with python and streamlit.

Project 1

Global COVID-19 Analytics Hub

The COVID-19 Data Analysis Dashboard is an interactive web app for exploring, visualizing, and forecasting global COVID-19 trends using data from Our World in Data. Users can analyze country-level stats, compare regions, track vaccinations, and detect anomaliesβ€”all in one place.

Streamlit Plotly Scikit-learn Statsmodels Time Series Analysis Data Visualization Exploratory Data Analysis
Project 2

World Happiness Report Dashboard (2011-2024)

An interactive dashboard that visualizes and analyzes global happiness scores and trends from 2011 to 2024. Dive into country-level insights, explore key factors influencing happiness, and uncover patterns through dynamic charts and data-driven storytelling.

Streamlit Plotly Pandas Statsmodels Time-Series Data Visualization
Project 3

News Sentiment Analysis App

A multipage Streamlit app for real-time news sentiment analytics. Fetches news, analyzes sentiment (using NLTK VADER), and provides interactive visualizations and data export tools.

Streamlit Plotly News API Natutal Language Processing VADER NLTK WordCloud Data Visualization
Project 3

Global Tuberculosis (TB) Burden Dashboard

A Streamlit web application for exploring, visualizing, analyzing and uncovering the trends the global burden of Tuberculosis (TB) using data from the World Health Organization (WHO).

Streamlit Plotly Public Health Epidemiology Pandas Data Analysis Data Visualization

Data Science Projects

Advanced Data Science projects with streamlit.

Financial Portfolio Analyzer Demo

πŸ“Š Financial Portfolio Analyzer

A comprehensive financial analysis platform combining traditional metrics with AI/ML capabilities. Features include real-time portfolio tracking, technical analysis, risk assessment, AI-driven forecasting, and sentiment analysis.

Streamlit Scikit-learn Statsmodels Time Series Analysis Sentiment Analysis
Crypto Dashboard Demo

πŸͺ™ Crypto Dashboard

An interactive multi-page dashboard for exploring real-time and historical cryptocurrency data using the CoinGecko API. Offers analytics, visualizations, forecasting, and portfolio tools for both casual users and crypto enthusiasts.

Streamlit Plotly Prophet Statsmodels ARCH NLTK Time Series Analysis Forecasting Crypto Analytics

Machine Learning Projects

Advanced machine learning models with streamlit.

AutoML Demo

πŸ€– AutoML Web App πŸ”¬

A comprehensive automated machine learning platform that simplifies the ML workflow. Features include data preprocessing, model selection, hyperparameter tuning, and interactive result visualization.

Streamlit Scikit-learn Pandas NumPy MLOps Data Preprocessing Classification
MovieLens Recommendation

🎬 Movie Recommendation Engine

An advanced, interactive movie recommendation system built with machine learning and the MovieLens dataset. This web application helps users discover new films, explore cinematic trends, and uncover deep insights into viewing behaviors.

Streamlit SVD Scikit-learn Plotly NetworkX TMDB API Collaborative Filtering
Miscellaneous ML Projects

Data Science and Machine Learning Projects

This repository contains a collection of end-to-end data science and machine learning projects, each focused on a different algorithm or technique. Every project includes data preparation, model building, evaluation, and insightful visualizations, with clear documentation throughout

Linear Regression Logistic Regression KNN SVM Decision Tree Random Forest AdaBoost Gradient Boosting NLP-Naive Bayes KMeans DBSCAN PCA Linear Discriminant Analysis

SQL Projects

Advanced database solutions and complex query implementations with SQL.

Project 1

E-commerce Database Creation and Analysis

This project centers around the design, creation, and querying of a relational SQL database based on the Brazilian E-Commerce Public Dataset by Olist. It highlights how raw CSV data from a real-world marketplace can be transformed into a structured, normalized relational database for robust analysis.

SQL PostgreSQL Database Optimization Data Analysis Data Manipulation Data Visualization
Project 2

AirBnB-NYC

This project provides a robust pipeline for cleaning, storing, querying, and visualizing AirBnB data for New York City. It leverages PostgreSQL for relational storage, Python for ETL and analysis, and Jupyter/Seaborn for rich exploratory data analysis (EDA).

SQL ETL Python Database Data Analysis Data Manipulation Data Visualization

Data Visualization Projects

Interactive and insightful dashboards created using Tableau.

Project 1

Global Economic Trends

Interactive dashboard visualizing complex economic indicators across different countries.

Tableau Data Visualization Economics
Project 2

Healthcare Analytics

Comprehensive visualization of healthcare metrics and patient outcome trends.

Tableau Healthcare Analytics